Rivur Verify
Codename: I-TRAP (Intelligent Talent Risk Assessment Program). Automate collection, monitoring, and analysis across Surface Web, Deep Web, and Dark Web to uncover hidden relationships and risk indicators that traditional methods miss with our bespoke Investigate AI agents.
Intelligence Workflow
End-to-end automation from discovery to actionable intelligence
Pre-Screening & Input
Initial entity identification and data ingestion from multiple sources. System accepts names, emails, corporate identifiers, and social handles.
Automated Collection
Investigate AI agents query structured and unstructured datasets across Surface, Deep, and Dark Web sources using commercial APIs and webhooks.
AI Analysis & Scoring
CRAWL methodology processes data to identify patterns, relationships, and risk indicators. Each entity receives Red-Yellow-Blue risk scoring.
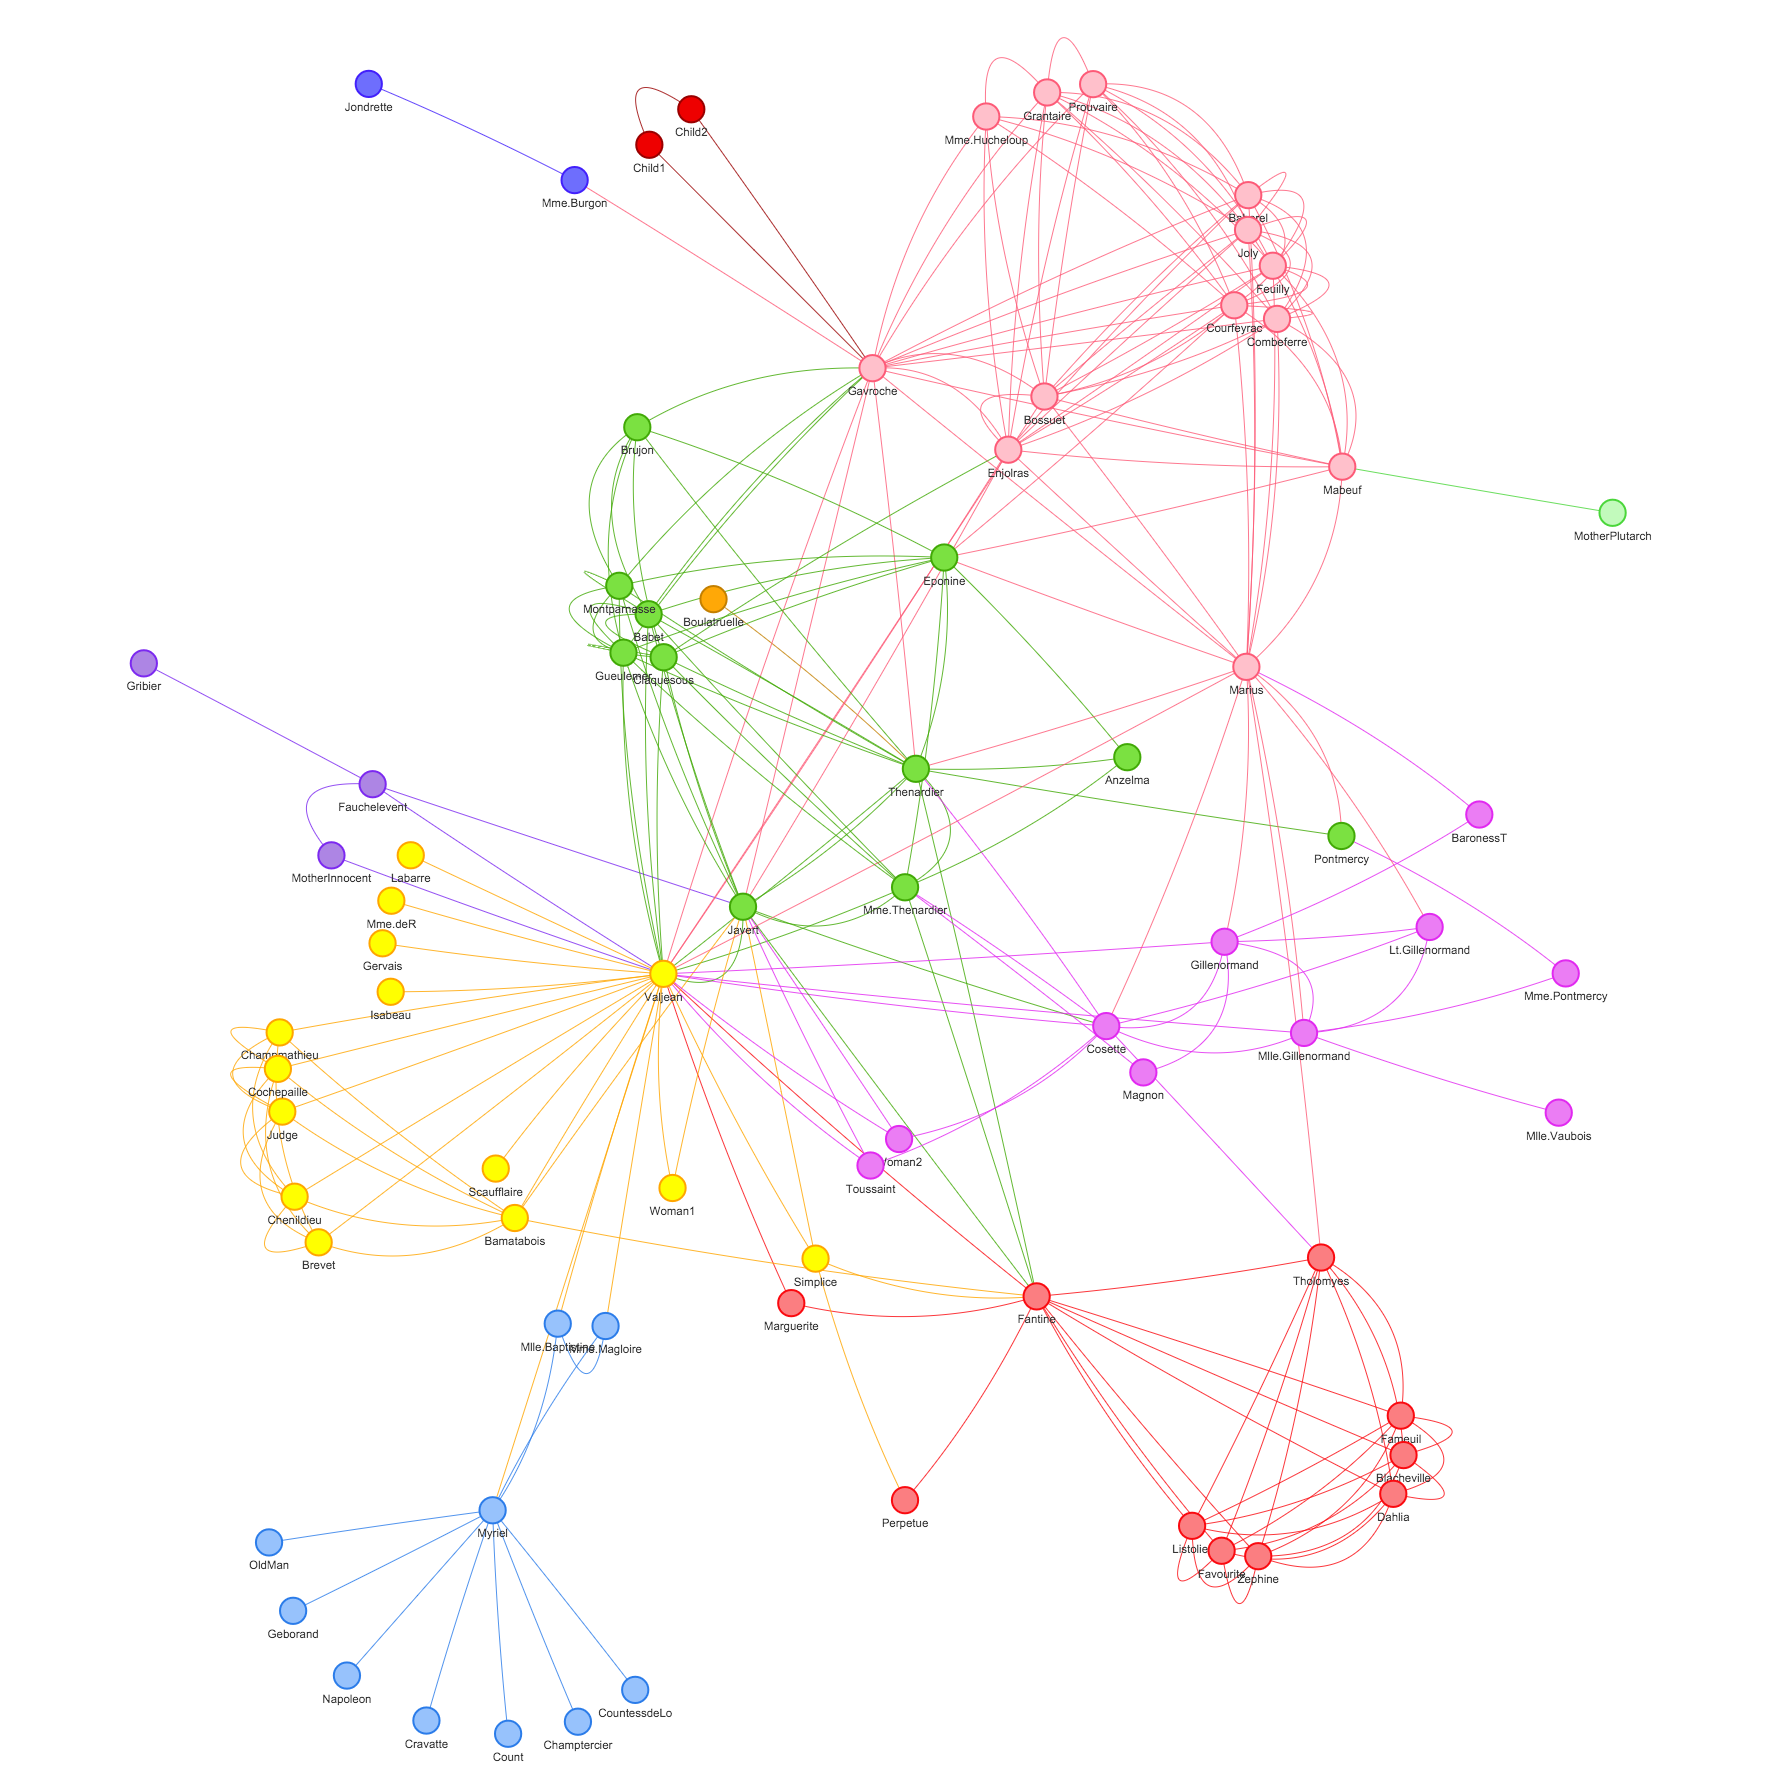
Knowledge Graph Generation
Dynamic Vis.js visualization creates interactive relationship maps with risk-weighted connections and expandable discovery nodes.
Report & Monitor
Export formatted PDF reports with comprehensive risk assessments. Enable continuous monitoring with automated alerts for profile changes.
Ethical AI Governance
Guided by the Artificial Intelligence and Data Act (AIDA) framework
Transparency
Clear documentation of AI decision-making processes and data sources used in risk assessments.
Accountability
Full audit trails and compliance with Canadian legal, ethical, and privacy laws.
Safety & Fairness
Continuous monitoring for bias and adherence to human rights principles in all assessments.
CRAWL Methodology
AI-Powered Intelligence Gathering Framework
Communicate
Define the process
Communicate what data sources will be used to conduct the screening.
Research
Gather the data
Gather the data from the information given from the sources defined in the communicate step.
Analysis
Advanced Pattern Recognition & Risk Assessment
Investigate AI agents analyze collected data using machine learning algorithms to identify patterns, relationships, and potential risk indicators. Each entity is assigned a Red-Yellow-Blue risk score based on the analysis.
Write
Comprehensive Report Generation & Visualization
The report is generated based on the analysis and presented in a dynamic Vis.js knowledge graph format, illustrating relationships and risk-weighted connections. The report can be exported as a formatted PDF document for easy sharing and review.
Listen
Continuous Monitoring & Alert Management
Monitor profiles continuously for changes or new risk indicators. Automated alerts notify users of significant updates, ensuring ongoing vigilance and risk management.